
Elections Have Consequences
Six Market Takeaways from the Midterm Elections
What the changing political landscape could mean for interest rates, currencies, and investment opportunities
The midterm elections have reshaped the political landscape in Washington, with potentially significant implications for financial markets.
Rather than revisit the political consequences of the election, which have already received extensive coverage, we will focus on what matters most to investors: how shifting policy priorities could influence asset prices, capital flows, and sector performance.
Government policy remains a powerful driver of financial markets. Through fiscal spending, taxation, regulation, legislation, and foreign policy, Washington can meaningfully influence economic growth, inflation, and investment decisions.
The election results suggest growing voter dissatisfaction with several administration priorities, including tariffs, the Iran conflict, and aspects of the rapid expansion of AI infrastructure. However, translating electoral sentiment into policy changes will take time, particularly with a divided government.
Against that backdrop, we see six potential market implications worth monitoring.
1. Interest Rates and Credit Markets: A Changing Environment
A shift in the political balance could reduce pressure on the Federal Reserve to pursue accommodative monetary policy. However, the Fed's decisions will ultimately depend on inflation, employment, and broader economic conditions.
If inflation remains persistent, the Fed may maintain restrictive monetary policy longer than markets currently anticipate. This could keep short-term interest rates elevated and contribute to a flatter yield curve.
Meanwhile, any moderation in AI-related infrastructure spending could reduce demand for long-term financing, potentially easing upward pressure on longer-term yields.
In corporate credit markets, a slowdown in capital-intensive AI investment could also expose differences in balance-sheet strength and financing needs. Credit spreads may widen, particularly among highly leveraged issuers.
Investment implication: Bond investors should place greater emphasis on credit quality, issuer fundamentals, and duration management rather than relying primarily on yield.
2. The U.S. Dollar: Potential Headwinds from Slower Capital Inflows
The extraordinary expansion of AI investment has helped attract substantial foreign capital into U.S. equities, technology companies, and infrastructure projects. These inflows have been one source of support for the U.S. dollar.
If AI-related investment, equity valuations, or IPO activity moderates, the pace of foreign capital inflows could slow, removing a potential source of dollar strength.
A more restrictive trade environment or changes in global risk appetite could further influence currency markets.
Investment implication: A softer dollar could improve returns on unhedged international investments for U.S.-based investors and provide a relative tailwind for emerging markets. However, interest-rate differentials and global risk sentiment will remain important determinants of currency performance.
3. Gold: Support from Policy Uncertainty and Dollar Weakness
Gold has historically served as a portfolio diversifier during periods of geopolitical uncertainty, declining confidence in financial assets, and currency weakness.
A weaker U.S. dollar would generally be supportive of gold prices, as would concerns about fiscal sustainability or renewed political uncertainty.
However, gold's outlook also depends heavily on real interest rates. Persistently elevated real yields could offset some of the benefits of dollar weakness.
Investment implication: Gold may continue to play a useful diversification role, particularly as a hedge against currency depreciation and geopolitical risk, although its performance is far from guaranteed.
4. Cryptocurrencies: Greater Regulatory and Political Scrutiny
The cryptocurrency industry has benefited from a relatively supportive policy environment under the Trump administration.
A Democratic-controlled Congress could increase oversight of digital assets, including potential investigations into conflicts of interest involving politically connected cryptocurrency ventures.
Greater scrutiny could also slow legislative initiatives favorable to the industry and introduce additional regulatory uncertainty.
However, the implications would not necessarily be uniformly negative. Clearer regulatory standards could ultimately benefit established digital-asset businesses and institutional adoption.
Investment implication: Cryptocurrency markets may face increased policy-driven volatility. Investors should distinguish between speculative digital assets and businesses with sustainable revenue models and regulatory resilience.
5. Healthcare: Potential Benefits from a Shift in Policy Priorities
Rising healthcare costs and access to affordable coverage were important concerns for voters.
A more Democratic-leaning Congress could prioritize preserving or expanding Affordable Care Act subsidies, protecting Medicaid funding, and limiting further reductions in federal healthcare support.
Such measures could benefit certain healthcare providers, hospitals, and managed-care organizations by supporting insurance coverage and reducing uncompensated care.
However, the healthcare sector is far from homogeneous. Pharmaceutical companies, insurers, hospitals, and medical-device manufacturers face different regulatory and reimbursement risks.
Investment implication: Hospitals and healthcare service providers could benefit from greater stability in federal coverage programs, while investors should remain selective across healthcare subsectors.
6. Clean Energy and Infrastructure: Renewed Policy Support
Renewable energy and environmental infrastructure faced a less supportive federal policy environment under the Trump administration.
A shift in congressional priorities could help preserve existing incentives, support clean-energy investment, and increase attention to environmental infrastructure.
Solar, wind, grid modernization, energy storage, and water infrastructure could all benefit from greater policy stability.
Nevertheless, legislation, permitting requirements, financing costs, and global competition will continue to shape industry profitability.
Investment implication: Select opportunities may emerge in renewable power, grid infrastructure, energy storage, and water-related businesses. Companies with strong balance sheets and economically competitive technologies should be better positioned than those relying heavily on subsidies.
Final Thoughts: Policy Shifts Create Opportunities, Not Certainties
Elections can change the direction of government policy, but financial markets respond to much more than political outcomes.
Interest rates, corporate earnings, inflation, global capital flows, and investor expectations will ultimately determine how these potential developments translate into asset prices.
The most important distinction for investors is between what policymakers may want to accomplish and what they can realistically implement.
For now, we believe the changing political environment reinforces the importance of diversification, disciplined credit selection, and a selective approach to sectors most exposed to regulatory and fiscal policy changes.
As always, our focus remains on positioning portfolios for a range of possible outcomes rather than relying on any single political or economic forecast.
October Recap and November Outlook
October ended with a sharp reminder that a month can look very different by its final trading day. A late selloff left the S&P 500 down 0.93% for October and the Nasdaq Composite down 5.30%. The Dow Jones Industrial Average held on to a 1.70% gain. For investors, those different outcomes made the mix of holdings in a portfolio especially important.
The economic backdrop was equally uneven. The latest reports showed stronger third-quarter growth, modest hiring, and inflation pressure from energy. The Federal Reserve held its policy rate steady, while Treasury yields fell from September's closing levels. As November begins, the question is whether growth can remain resilient while inflation cools enough to give policymakers more room to maneuver.
Let's get into the data:
Hiring remained modest. The October 2 employment report showed that nonfarm payrolls rose by 29,000 in September, with unemployment at 4.2%. Revisions reduced July and August's combined job gains by 60,000. The October employment report is scheduled for November 6. [1]
Energy kept inflation in focus. September's Consumer Price Index, released October 14, rose 0.6% for the month and 3.7% from a year earlier. Excluding food and energy, prices increased 0.3% monthly and 2.6% annually. Gasoline rose 9.1%, accounting for more than half of the monthly headline increase. October CPI is scheduled for November 10. [2]
The Fed held rates steady. On October 28, the Federal Open Market Committee maintained its target range at 3.75% to 4.00%. Two members preferred a quarter-percentage-point increase. The decision left inflation as an ongoing concern rather than signaling that the work was finished. [3]
Growth accelerated in the third quarter. BEA's October 29 advance estimate showed real GDP expanding at a 3.4% annualized rate, following 2.2% in the second quarter. Investment, consumer spending, and government spending contributed to the increase. This is an initial estimate and remains subject to revision. [4]
What Does the Data Add Up To?
These reports describe an economy with momentum, but also pressure points. Stronger growth can support business revenue and household income. Slower hiring leaves less room for disappointment, while higher gasoline prices absorb money that consumers could otherwise spend elsewhere. The GDP report covers an entire quarter, and the employment report covers September; neither provides a complete picture of conditions at October's close.
The distinction between headline and underlying inflation also matters. A large gasoline increase can make the overall inflation number look worse without every category rising at the same pace. Even so, energy costs have a direct effect on household budgets. Investors will be watching whether subsequent reports show that pressure easing or spreading more broadly.
October also illustrated the difference between the Fed's policy rate and the interest rates set in financial markets. The Fed held its target range unchanged, yet the 10-year Treasury yield fell over the month. Treasury prices respond to expectations about future growth, inflation, policy, and demand for bonds. A decline in yields can support existing bond prices without a rate cut having occurred.
For stocks, falling yields did not produce a uniform gain. The Nasdaq's decline and the Dow's advance show why one benchmark cannot describe every investor's experience. Companies face different earnings expectations, financing needs, and valuations. A portfolio concentrated in one area can behave very differently from a broad allocation, even when both are described simply as investing in the stock market.
Chart of the Month: October's Diverging Stock Returns
October's major indexes finished far apart. The chart compares the same full-month period for all three, including the final trading day's losses. It shows price changes and excludes dividends.
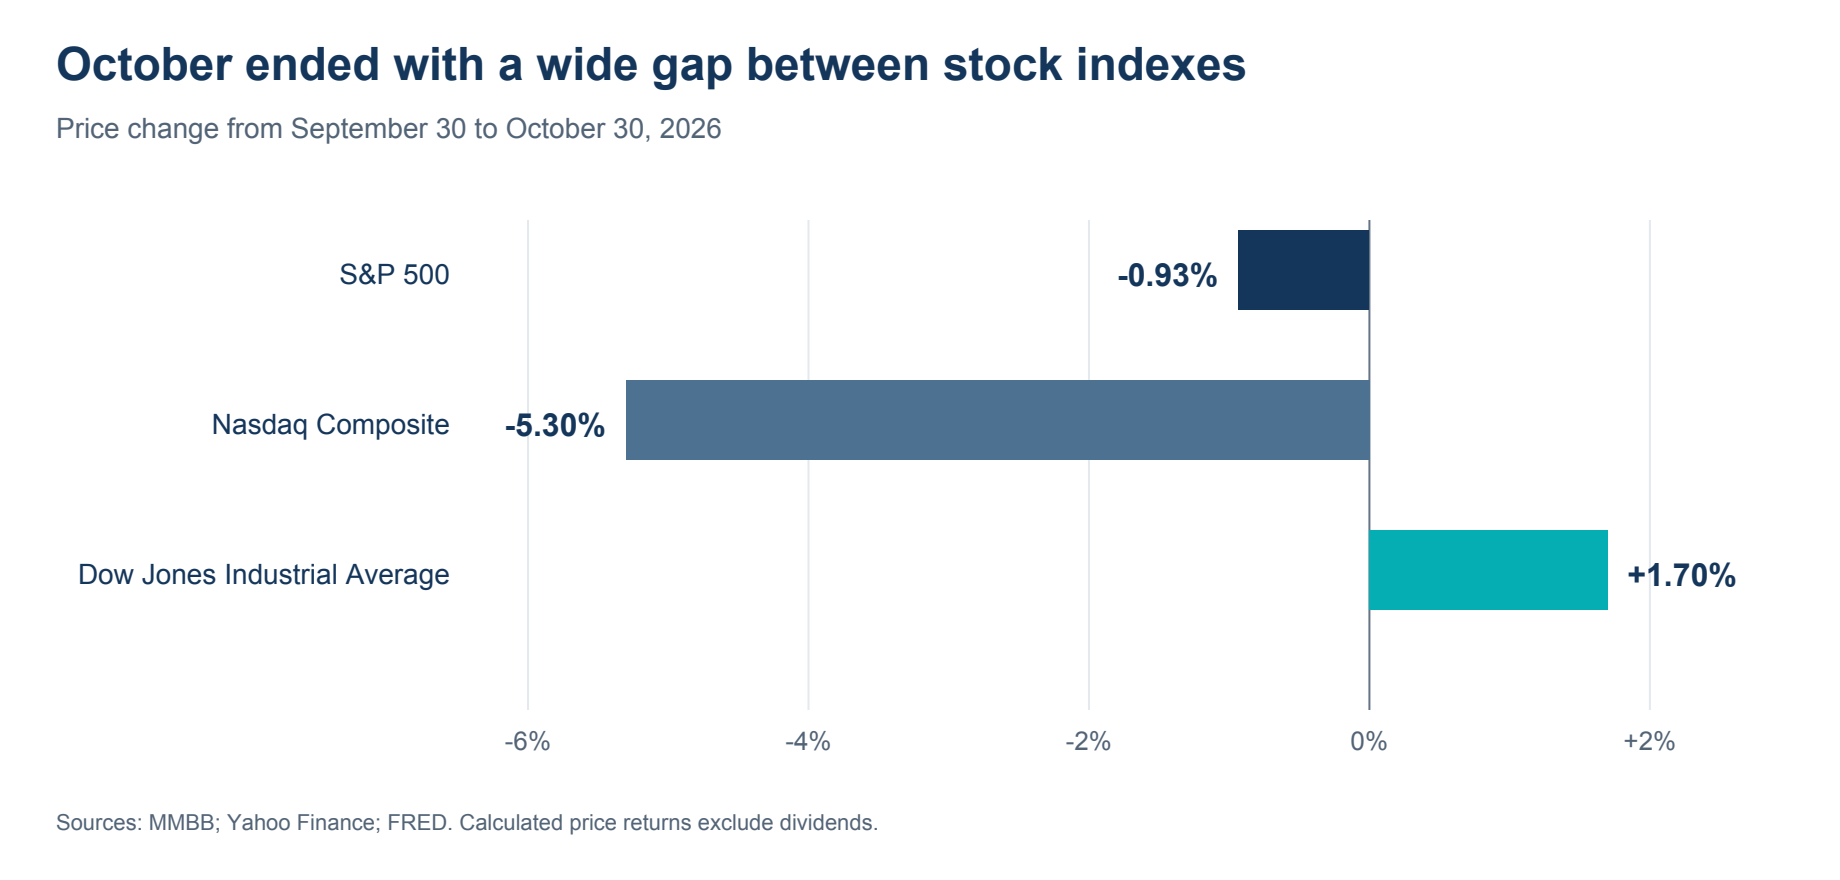
October 2026 price returns: S&P 500 -0.93%, Nasdaq Composite -5.30%, Dow Jones Industrial Average +1.70%. Calculated from September 30 and October 30 closing levels. Sources: [5] and [6].
Equity Markets in October
S&P 500: Closed at 7,580.07, down 0.93% for the month.
Nasdaq Composite: Closed at 25,437.00, down 5.30% for the month.
Dow Jones Industrial Average: Closed at 51,770.31, up 1.70% for the month.
The final session mattered: the S&P 500 fell 1.82% on October 30, turning its small gain through October 29 into a monthly loss. The Nasdaq declined 2.86% that day, while the Dow fell 1.09%. The Dow nevertheless finished above its September close. All monthly figures above compare September 30 with October 30 and exclude dividends. [5, 6]
Performance also varied significantly across different areas of the market. Technology-related sectors moved lower, while Energy, Consumer Staples, Utilities, and Health Care posted strong gains. This shift highlights how quickly market leadership can change and why looking beyond the major indexes can provide a more complete picture.
Bond Markets in October
Treasury yields declined across the maturities shown here. The 2-year yield fell from 4.88% on September 30 to 4.56% on October 30. The 10-year fell from 5.29% to 4.94%, and the 30-year declined from 5.64% to 5.31%. Those moves were decreases of 32, 35, and 33 basis points, respectively; one basis point is 0.01 percentage point. [7]
Lower yields generally support the prices of existing fixed-rate bonds, with longer-duration bonds more sensitive to rate changes. The benefit varies across holdings because maturity, credit quality, and changes in credit spreads also matter. These Treasury yield changes are not a measure of total bond-market returns. For investors planning future purchases, lower yields also mean a different starting income opportunity than at September's close.
The Smart Investor
A month with such different stock-index results is a useful time to review concentration. Several funds may still leave a portfolio heavily exposed to the same companies or investment style. Reviewing that overlap can be more informative than comparing an account with whichever index made the day's headlines.
It is also worth revisiting the purpose of each part of the portfolio. Money needed for near-term spending has a different job from investments intended to fund retirement years from now. A change in markets can be a reason to check those allocations against your plan, while any decision to rebalance should consider taxes, transaction costs, and your circumstances.
Recent economic data has continued to influence expectations for inflation and interest rates, but no single report will settle the outlook. Shifts in market leadership are also a reminder of the importance of diversification. We are here to help you put these developments in context and discuss whether your portfolio still reflects your goals, time horizon, and comfort with risk.
Sources
[1] Bureau of Labor Statistics — September 2026 Employment Situation, released October 2, 2026. Source
[2] Bureau of Labor Statistics — September 2026 Consumer Price Index, released October 14, 2026. Source
[3] Federal Reserve — FOMC statement, October 28, 2026. Source
[4] Bureau of Economic Analysis — Third-quarter 2026 GDP advance estimate, released October 29, 2026. Source
[5] MMBB — Quarterly Market Review, July–September 2026. Stock-index closing levels as of September 30, 2026. Source
[6] FRED — S&P 500 and Dow Jones Industrial Average; Yahoo Finance — Nasdaq Composite historical prices. October 29–30, 2026 closes. Monthly changes calculated from September 30 and October 30 closes. Source | Nasdaq history | Dow history
[7] U.S. Treasury — Daily Treasury Par Yield Curve Rates, September 30 and October 30, 2026. Source
The information contained herein is intended to be used for educational purposes only and is not exhaustive. Diversification and/or any strategy that may be discussed does not guarantee against investment losses but are intended to help manage risk and return. If applicable, historical discussions and/or opinions are not predictive of future events. The content is presented in good faith and has been drawn from sources believed to be reliable. The content is not intended to be legal, tax or financial advice. Please consult a legal, tax or financial professional for information specific to your individual situation.
This content not reviewed by FINRA
Disclosure information
The strategies discussed are strictly for illustrative and educational purposes and should not be construed as a recommendation to purchase or sell, or an offer to sell or a solicitation of an offer to buy any security. There is no guarantee that any strategies discussed will be effective. The information provided is not intended to be a complete analysis of every material fact respecting any strategy. The examples presented do not take into consideration commissions, tax implications, or other transactions costs, which may significantly affect the economic consequences of a given strategy. The information provided is not intended to be a tax advice. Investors should be urged to consult their tax professional or financial advisers for more information regarding their specific tax situations.